Automated Go API Diagnosis Arrives
The familiar ritual of debugging a slow or error-prone Go API often involves staring into the abyss of observability dashboards. Developers typically navigate Grafana, Prometheus, and distributed tracing systems, cross-referencing metrics to pinpoint issues like garbage collection pressure or saturated connection pools. This process, dubbed the “Observability Tax,” consumes significant developer time and cognitive load. A new tool, mAPI-ng, aims to eliminate this tax by enabling Go APIs to diagnose themselves.
Built by Alex Human, mAPI-ng moves beyond simply presenting data. It actively interprets it. The tool correlates standard RED metrics (Rate, Errors, Duration) with Go runtime signals, instance health, and downstream I/O operations. When an endpoint exhibits problematic behavior, mAPI-ng doesn’t just flag an anomaly; it provides a ranked list of probable causes.
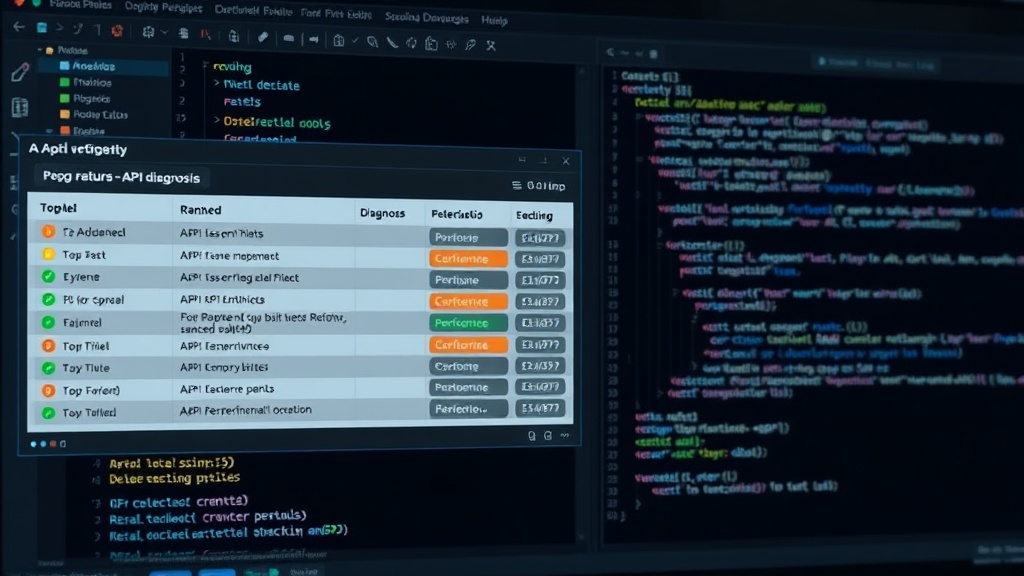
These diagnoses are presented with confidence levels, such as “Memory / GC pressure (High confidence)” or “Downstream IO bottleneck (Medium confidence).” The system also detects subtler issues like goroutine leaks. Crucially, each diagnosis is backed by a set of rules and metrics that explain the reasoning, allowing developers to verify the findings and understand the underlying problem without deep diving into raw data streams.
The Observability Tax Problem
The proliferation of sophisticated observability tools like OpenTelemetry, Prometheus, and Grafana has empowered teams to monitor their systems with unprecedented detail. However, this power comes at a cost. Setting up and maintaining these systems requires specialized knowledge and considerable engineering effort. Even with a robust setup, extracting actionable insights from the flood of data can be challenging. The time spent configuring exporters, defining dashboards, writing alerts, and then interpreting the results is a substantial overhead. This is the “Observability Tax” that mAPI-ng seeks to alleviate.
Traditional approaches rely on developers to infer problems by looking for patterns across disparate data sources. A spike in request latency might correlate with increased CPU usage, higher GC pauses, or a slowdown in a dependent service. Identifying these correlations manually is time-consuming and error-prone. mAPI-ng automates this correlational analysis, presenting a synthesized view of the system’s health and potential failure modes.
How mAPI-ng Works
At its core, mAPI-ng operates by integrating deeply with the Go runtime and its standard observability primitives. It leverages Go’s built-in profiling and runtime metrics, which are often overlooked or underutilized in standard observability stacks. By combining these with external metrics (like request rates and durations) and network I/O data, the tool builds a holistic picture of application performance.
The diagnostic engine uses a rule-based system that defines specific conditions indicative of common performance bottlenecks. For instance, a combination of high goroutine count, elevated GC pause times, and increased memory allocation rates might trigger a “Memory / GC pressure” diagnosis. Similarly, a consistent increase in request duration correlated with slow responses from external HTTP clients or database queries would flag a “Downstream IO bottleneck.”
The confidence scoring is derived from the number and strength of the correlating signals. A diagnosis with “High confidence” means multiple, strong indicators point to that specific issue. A “Medium confidence” diagnosis suggests a plausible cause, but perhaps with fewer corroborating signals or some ambiguity in the data.
Evidence-Backed Diagnoses
What sets mAPI-ng apart is its emphasis on evidence. Instead of merely presenting a diagnosis, it provides the underlying data and rules that led to it. For example, a diagnosis might include:
- Rule Triggered: High GC Pause Time
- Metrics Correlated: Pacer.PauseTotalNs increased by 300% over 5 minutes.
- Runtime Signal: Significant increase in `runtime.gc.` events.
- Instance Health: CPU utilization at 85%.
This transparency is critical. It allows developers to quickly validate the diagnosis and understand the specific metrics that are problematic. This is akin to a doctor not just telling you you're sick, but explaining which lab results and symptoms led to that conclusion. This approach reduces the need for extensive manual investigation and accelerates the path to resolution.
Beyond Basic Metrics
While standard RED metrics are foundational, mAPI-ng goes further by integrating Go-specific runtime data. This includes metrics related to:
- Goroutine lifecycle and stack traces
- Garbage collection behavior (pause times, allocation rates)
- Memory usage patterns
- Channel operations and blocking
By correlating these internal signals with external performance indicators, mAPI-ng can identify issues that might be invisible to traditional, external-only monitoring tools. For instance, a subtle goroutine leak might not immediately impact request latency but could lead to memory exhaustion over time. mAPI-ng’s ability to detect such issues early provides a significant advantage in maintaining system stability and preventing cascading failures.
The Future of API Observability?
mAPI-ng represents a shift from passive data collection to active, intelligent diagnosis. By embedding diagnostic capabilities directly within the API, it promises to reduce the complexity and cost associated with maintaining high-performance, reliable services. For development teams struggling with the overhead of comprehensive observability stacks, tools like mAPI-ng offer a compelling alternative or complement, allowing them to focus more on building features and less on deciphering dashboards.
The question remains: will this self-diagnostic approach become a standard pattern for microservices, or is it a niche solution for Go-specific challenges? The potential for similar tools in other language runtimes is clear, suggesting a broader trend towards making complex systems more interpretable and easier to manage.