
Integrating Firebase Analytics is an excellent first step toward understanding how users interact with your application—but it's only the beginning. The real value comes from Google Analytics 4 (GA4), where raw events are transformed into meaningful reports, dashboards, funnels, audiences, and business insights. GA4 helps developers, product managers, and marketers answer critical questions about user acquisition, feature engagement, conversion paths, and overall user experience improvement.
This article dives into the core GA4 features essential for any mobile developer aiming to leverage data for strategic decision-making.
Understanding the GA4 Interface and Core Reports
GA4 offers a more flexible and event-driven data model compared to its predecessor, Universal Analytics. For mobile app developers, this shift means understanding how user interactions are captured and reported. The primary reports provide a foundational view of app performance.
Realtime Report
The Realtime report is your immediate window into user activity. It shows events, users, and conversions happening within the last 30 minutes. This is invaluable for debugging new event implementations, monitoring the immediate impact of marketing campaigns, or observing user behavior during live app updates or events. For instance, if you've just pushed a new feature, you can use the Realtime report to see if users are interacting with it as expected, and if the associated events are firing correctly. It provides a live feed, allowing for quick validation and troubleshooting without waiting for standard reporting cycles.
Reports Snapshot
The Reports Snapshot provides a high-level overview of your app's performance. It aggregates key metrics such as users, sessions, revenue, and engagement time. This section serves as a dashboard for a quick pulse check on the app's health. It's designed for a broad audience, offering digestible insights that can prompt further investigation into more detailed reports. For product managers, this snapshot can highlight trends in user acquisition or engagement that warrant deeper analysis.
Core GA4 Concepts: Events and Screen Tracking
At the heart of GA4's data model is the event. Unlike Universal Analytics, which had a strict hierarchy of sessions, users, and pageviews, GA4 treats almost every interaction as an event. This event-driven approach offers greater flexibility and more granular data collection, especially for mobile applications where user interactions can be highly diverse.
Events: The Foundation of GA4 Data
Every user interaction in your app can be logged as an event. GA4 automatically collects certain events (like `first_open` for apps or `session_start`), but the real power lies in defining and tracking custom events that are specific to your app's functionality. For example, if your app has a 'save article' feature, you would create a custom event named `save_article` to track how often users utilize this function. Each event can also have associated parameters, which provide additional context. For the `save_article` event, parameters could include `article_id`, `article_title`, or `user_segment`.

Screen Tracking
For mobile apps, understanding user navigation is crucial. GA4 automatically tracks screen views using an event called `screen_view`. Each `screen_view` event has parameters like `screen_name` and `screen_class`, which identify the specific screen a user has viewed. This is GA4's equivalent to Universal Analytics' pageviews. By analyzing `screen_view` events, you can understand which screens are most popular, how users navigate between them, and where they might be getting lost. For instance, tracking the `screen_name` for a checkout process can reveal drop-off points.
Enhancing Insights with Custom Definitions and Audiences
While GA4's automatic tracking provides a solid foundation, custom definitions and audiences allow you to tailor the data to your specific business needs and user segments.
Custom Definitions: Parameters and User Properties
Custom definitions allow you to organize and analyze the parameters and user properties you send with your events. There are two main types:
- Event Parameters: These are attributes of a specific event. For example, if you track a `purchase` event, you might include parameters like `item_name`, `price`, and `currency`. You can then register these parameters as custom dimensions in GA4 to use them in your reports and explorations.
- User Properties: These describe segments of your user base, such as `user_level`, `preferred_language`, or `subscription_status`. User properties are persistent and apply to all events from a given user. Registering them as custom dimensions allows you to analyze user behavior based on these characteristics.
The ability to define and use custom parameters and user properties means you can move beyond generic metrics and analyze behavior based on attributes highly relevant to your app. For example, segmenting users by `user_level` and analyzing their feature adoption rates provides much deeper insights than just looking at overall feature usage.
Audiences
Audiences in GA4 are subsets of your users defined by specific criteria. These criteria can be based on events, user properties, or combinations thereof. For example, you could create an audience for 'High-Value Purchasers' (users who have made more than two purchases) or 'Disengaged Users' (users who haven't opened the app in 7 days). These audiences can then be used for deeper analysis in reports, explorations, and for remarketing campaigns in Google Ads. Building audiences allows you to understand and target specific user segments more effectively, driving personalized experiences and marketing efforts.
Leveraging GA4 for Business Insights
The ultimate goal of implementing GA4 is to gain actionable business insights that drive growth and improve the user experience. By effectively tracking events, understanding user flows, and segmenting users, you can make data-driven decisions.
Funnels and Funnel Exploration
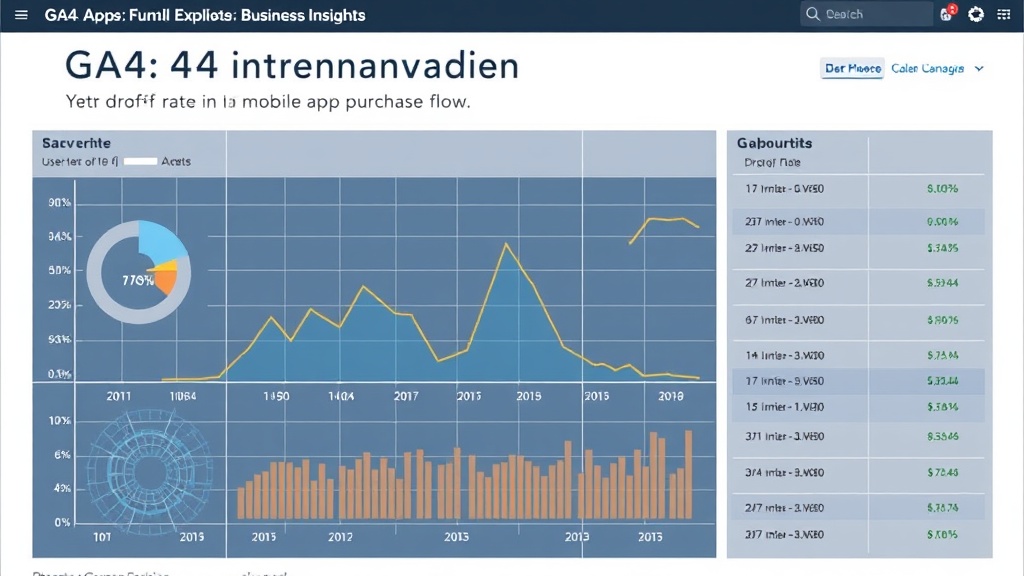
Funnels are critical for understanding user journeys through key processes in your app, such as onboarding, checkout, or feature activation. GA4's Funnel Exploration tool allows you to visualize these steps and identify where users are dropping off. By analyzing the drop-off rates at each stage, you can pinpoint usability issues or points of friction in your app's design or flow. For example, a high drop-off rate between the 'Add to Cart' and 'Initiate Checkout' steps might indicate a problem with the cart summary or the visibility of the checkout button.
User Engagement and Retention Analysis
GA4 provides metrics like Engagement Rate, Average Engagement Time, and User Retention reports. Analyzing these metrics helps you understand how well your app keeps users engaged over time. High engagement rates and long average engagement times, coupled with strong retention, indicate a healthy and valuable user experience. Conversely, declining engagement or retention signals potential problems that need addressing, perhaps through new features, improved onboarding, or targeted re-engagement campaigns.
Mastering GA4 for mobile apps involves moving beyond basic event tracking. It requires a strategic approach to defining custom events and parameters, leveraging custom dimensions and user properties, building meaningful audiences, and utilizing advanced exploration tools like funnels. By doing so, you transform raw data into the strategic business insights needed to optimize your app, enhance user experience, and drive sustainable growth.