
The Shifting Sands of Stock Return Explanation
In the realm of financial analysis, understanding why a stock moves is paramount. The Fama-French 5-factor model, a cornerstone for decomposing stock returns, offers a systematic framework for this inquiry. Instead of merely observing price changes, it seeks to quantify how much of a stock's return is attributable to exposure to known risk premia, and how much is specific to the company. This distinction is crucial for investors and analysts alike, impacting portfolio construction and the repeatability of perceived outperformance.
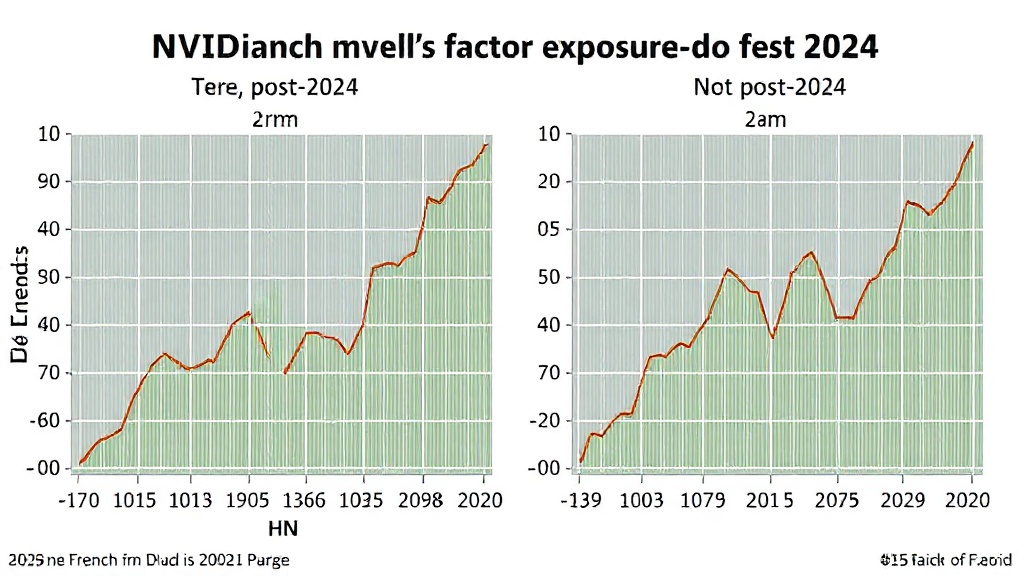
A striking case study emerges from the recent performance of NVIDIA. In 2023, the Fama-French 5-factor model could explain only 35% of NVIDIA's weekly return variation. This low explanatory power suggests that the primary drivers of its stock price were factors not captured by the model – essentially, a powerful narrative that the market had not yet fully priced in. The narrative centered on the impending scarcity of GPUs and their critical role in defining AI infrastructure for years to come. By 2024, however, the situation transformed dramatically. The model now explains a remarkable 82% of NVIDIA's weekly returns. This shift indicates that the market has largely incorporated the AI infrastructure insight into its valuation, causing NVIDIA's stock to behave more like a large-cap bellwether, influenced by systematic market factors, rather than a purely thematic trade.
This dramatic change in explanatory power between 2023 and 2024 for NVIDIA offers a profound lesson. It highlights how market sentiment and evolving narratives can temporarily decouple a stock's price action from established financial models. When a story is potent enough, it can drive returns irrespective of systematic risk exposures. However, as information diffuses and the market digests the implications, the stock's behavior tends to revert to a more factor-driven pattern. This transition is not unique to NVIDIA; understanding this dynamic is key to interpreting stock movements in rapidly evolving sectors.
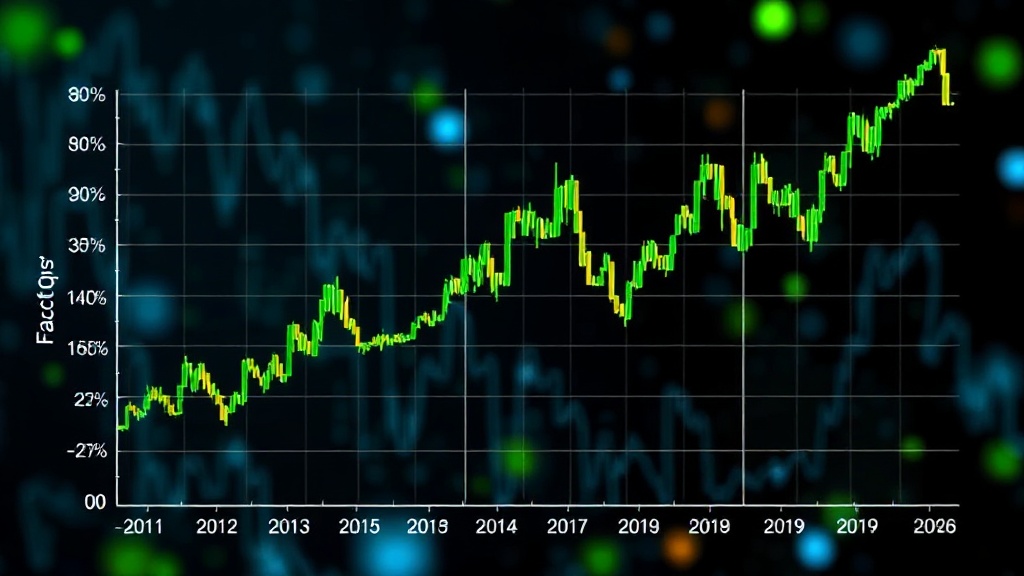
Understanding the Fama-French 5-Factor Model
Developed by Eugene Fama and Kenneth French, the Fama-French model extends the Capital Asset Pricing Model (CAPM) by incorporating additional factors that have empirically shown to explain cross-sectional differences in stock returns. The original 3-factor model included market risk (Beta), size (SMB - Small Minus Big), and value (HML - High Minus Low). The subsequent 5-factor model adds two more dimensions: profitability (RMW - Robust Minus Weak) and investment (CMA - Conservative Minus Aggressive).
- Market Risk (Mkt-RF): The excess return of the market over the risk-free rate. This is the CAPM's core factor.
- Size (SMB): The excess return of small-cap stocks over large-cap stocks. Historically, smaller companies have tended to outperform larger ones.
- Value (HML): The excess return of value stocks (high book-to-market ratio) over growth stocks (low book-to-market ratio). Value stocks have historically outperformed growth stocks.
- Profitability (RMW): The excess return of companies with robust (high) operating profitability over those with weak (low) operating profitability. More profitable firms tend to yield higher returns.
- Investment (CMA): The excess return of companies that invest conservatively (low asset growth) over those that invest aggressively (high asset growth). Firms that invest less tend to generate higher returns.
The model posits that a stock's expected return can be explained by its sensitivity (or "beta") to these five factors. A stock with a high positive beta to SMB, for example, is expected to perform better when small-cap stocks outperform large-cap stocks. Conversely, a high negative beta to CMA suggests the stock is expected to do well when aggressive investors are punished. By running a regression of a stock's historical returns against these factors, analysts can ascertain its factor exposures and the proportion of its returns explained by the model.
NVIDIA: A Case of Narrative Dominance and Factor Reversion
NVIDIA's journey through 2023 and into 2024 provides a compelling, real-world illustration of the Fama-French model's explanatory power, and its limitations when narratives take hold. In 2023, NVIDIA's stock experienced an explosive surge, largely fueled by the market's dawning realization of the pivotal role its GPUs would play in the artificial intelligence revolution. This was a narrative-driven rally. The demand for AI training and inference chips outstripped supply, positioning NVIDIA as the essential backbone of this transformative technology. However, the Fama-French 5-factor model could only account for 35% of the weekly returns during this period. This meant that the vast majority of the stock's movement was idiosyncratic, driven by the sheer force of market excitement and future expectations that weren't yet fully embedded in systematic risk factors.
The surprise here is not that a narrative can drive stock prices, but the dramatic *speed* at which the market caught up and realigned NVIDIA's returns with systematic factors. By 2024, the narrative had matured. The market had digested the implications of GPU scarcity and AI infrastructure dominance. Companies like NVIDIA, previously seen as hyper-growth, thematic plays, began to exhibit characteristics more aligned with established large-cap companies. Investors started assessing them through the lens of profitability, investment strategies, and broader market movements, rather than solely on the AI narrative's momentum. Consequently, the Fama-French 5-factor model's ability to explain NVIDIA's weekly returns jumped to 82%. This indicates that the stock's price action was now largely driven by its exposure to the market factor, size, value, profitability, and investment factors, much like other large, established technology bellwethers. The narrative had been priced in, and systematic factors were once again the primary drivers.
Broader Implications for Portfolio Management and Analysis
The NVIDIA example offers critical insights for anyone managing portfolios or analyzing stock performance. Firstly, it underscores the importance of distinguishing between narrative-driven rallies and factor-driven performance. While narratives can create significant short-to-medium term gains, they are often transient. A stock performing exceptionally well due to a powerful story, but with low explanatory power from systematic factors, carries a higher risk of reverting to the mean once the narrative loses steam or becomes fully priced. Investors relying solely on momentum or thematic plays without considering underlying factor exposures might find themselves exposed to unexpected volatility.
Secondly, the Fama-French model, when applied consistently, can help identify whether outperformance is repeatable. If a manager consistently generates alpha, is it due to stock selection skill, or simply by tilting their portfolio towards factors like size or value that have historically commanded a premium? Understanding factor exposures helps to attribute performance accurately. For companies like NVIDIA, the transition from a narrative-driven stock to a factor-driven one suggests a maturation of the company and its market perception. This maturation might alter its risk profile and its suitability for different investment strategies. For instance, a portfolio manager focused on low-volatility factor exposures might find a 2024-era NVIDIA more attractive than its 2023 counterpart, even if the latter offered more explosive, albeit less predictable, growth.
The question that remains is how long this factor-driven behavior will persist for NVIDIA and similar AI-centric companies. As new technological paradigms emerge or as existing ones mature, the market's interpretation of systematic risks and rewards will undoubtedly evolve. The Fama-French model provides a robust lens, but it is a snapshot of current market dynamics, not a prophecy of future factor premiums. Its power lies in its ability to reveal the underlying structure of returns, helping us understand whether we are investing in a company's fundamental risk profile or merely riding a wave of market excitement.