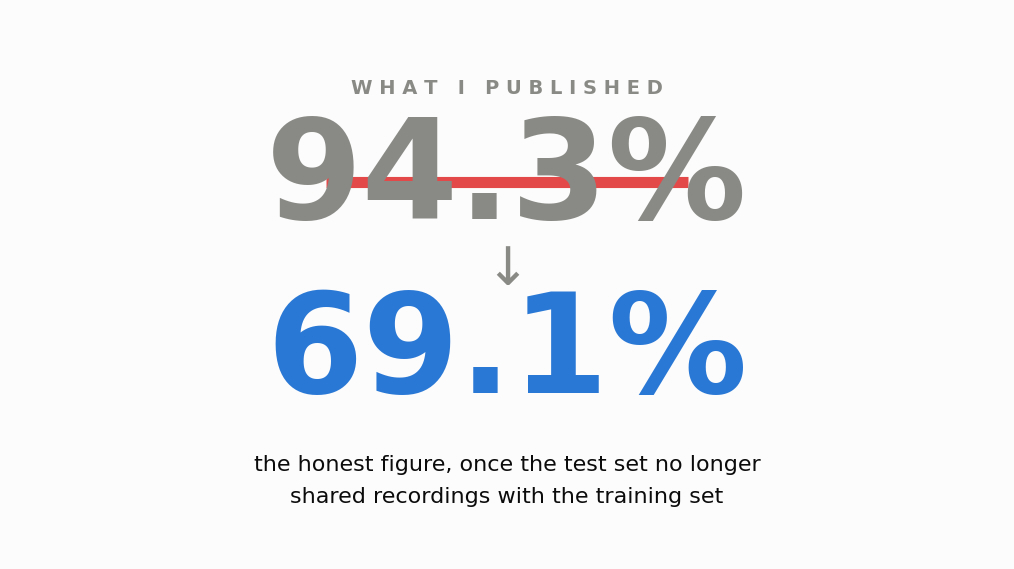
The Illusion of 94% Accuracy
Machine learning models, especially those deployed in critical applications like fall detection, are often evaluated using standard metrics. The common go-to is accuracy, a seemingly straightforward measure of how often the model gets it right. For a personal project aimed at detecting falls using sensor data, an accuracy score of 94% initially felt like a major success. This high score suggested the model was highly reliable, capable of distinguishing between a fall and normal activity with impressive precision. This level of performance would typically indicate that the system is ready for real-world deployment, a significant milestone for any developer.
However, this number was deeply misleading. The stark reality, uncovered through a deeper dive into the evaluation methodology, was that the model was not 94% accurate at its intended task. Instead, this inflated figure was a direct consequence of a poor evaluation choice: using accuracy on a heavily imbalanced dataset without proper consideration for class distribution. In scenarios where one class vastly outnumbers another, a model can achieve a deceptively high accuracy by simply predicting the majority class most of the time. For fall detection, where falls are inherently rare events compared to normal daily activities, this is a critical pitfall.
Unpacking the Evaluation Flaw: Accuracy on Imbalanced Data
The dataset used for training and evaluation contained a significant disparity between the number of 'fall' events and 'non-fall' events. Imagine a scenario where 1000 data points represent normal activity, but only 50 represent falls. A naive model that always predicts 'normal activity' would be correct 1000 out of 1050 times, yielding an accuracy of approximately 95.2%. In this context, the 94% accuracy score achieved by the model was not a testament to its ability to detect falls, but rather its proficiency in correctly identifying the far more frequent 'non-fall' events. It was essentially a model that was good at ignoring falls.
This is a common trap in machine learning, particularly when dealing with anomaly detection or rare event prediction. Standard accuracy metrics fail to capture the model's performance on the minority class, which is often the class of greatest interest. In fall detection, correctly identifying a fall is paramount, even if it means having a few more false alarms (predicting a fall when none occurred) than a model that misses most falls. The high accuracy masked the model's severe deficiency in detecting the actual target event – a fall.
Rebuilding Trust: Towards Honest Evaluation
The realization that the model was fundamentally flawed prompted a rebuild with a focus on more robust evaluation metrics. The key was to shift from a single, misleading metric to a suite of metrics that provide a more nuanced understanding of performance. This involved:
- Precision and Recall: Precision measures the proportion of correctly predicted falls out of all instances predicted as falls. Recall (also known as sensitivity) measures the proportion of correctly predicted falls out of all actual falls. A good fall detection model needs high values for both.
- F1-Score: This metric provides a harmonic mean of precision and recall, offering a single score that balances both. It's particularly useful when class distribution is uneven.
- Confusion Matrix: A detailed breakdown of true positives, true negatives, false positives, and false negatives. This visual tool is indispensable for understanding where the model is making errors.
By retraining the model and evaluating it using these more appropriate metrics, the true performance became apparent. The initial 94% accuracy was replaced by a much lower, yet more honest, recall score. For instance, the model might now have a recall of 60% – meaning it detects 6 out of 10 falls – while maintaining a reasonable precision and a respectable F1-score. This is a far more realistic representation of its capabilities and limitations.
Lessons Learned for Dependable ML Systems
This experience underscores a critical lesson for anyone building or deploying ML systems, especially those with real-world consequences. The choice of evaluation metric is not a trivial detail; it is foundational to understanding a model's true utility and reliability. Relying on a single, easily inflated metric like accuracy on imbalanced data is akin to building a house on a shaky foundation – it looks stable from a distance, but it's prone to collapse under stress.
Developers must cultivate a critical mindset towards performance numbers. Always question how a metric was derived, especially when dealing with datasets that are not uniformly distributed. Understand the trade-offs between different metrics and choose those that best reflect the actual goals and risks of the application. For fall detection, a system that misses many falls is a dangerous system, regardless of its headline accuracy. Building ML systems that people can depend on requires not just sophisticated algorithms, but also rigorous, honest, and context-aware evaluation practices. It means prioritizing the detection of critical events, even at the cost of increased false positives, rather than chasing a vanity metric.
What remains unaddressed in many such projects is the long-term impact of deploying models with even slightly compromised evaluation. While this personal project highlighted a 25-point inflation, real-world systems might suffer from subtler, yet equally damaging, misrepresentations of performance, leading to critical failures in high-stakes scenarios.