Understanding the Need for eBPF Profiling
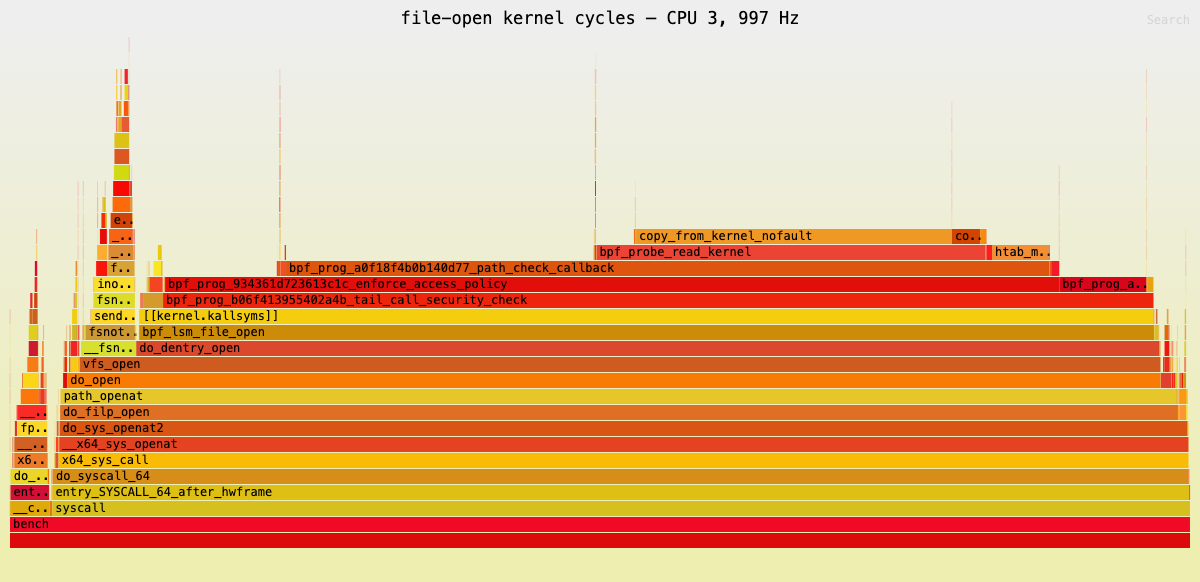
eBPF (extended Berkeley Packet Filter) programs offer unparalleled visibility into the Linux kernel and user-space applications. They are powerful tools for networking, security, and observability. However, like any code, eBPF programs can introduce performance overhead or unexpected behavior. Profiling eBPF code is essential to identify bottlenecks, optimize resource usage, and ensure the stability of your system. Without proper profiling, it's difficult to understand where your eBPF programs are spending their time or if they are contributing to system slowdowns.
The challenge with eBPF profiling stems from its in-kernel execution. Traditional user-space profiling tools often don't apply directly. You cannot simply attach a gprof or perf to an eBPF program running within the kernel's context. Instead, you need specialized techniques that leverage eBPF's own capabilities or integrate with kernel tracing mechanisms.
Core eBPF Profiling Techniques
1. Using eBPF-based Tracing Tools
The most direct way to profile eBPF code is by using other eBPF programs designed for tracing and performance analysis. Tools like bpftrace are invaluable here. bpftrace itself is an eBPF-powered tracing tool that uses a high-level scripting language inspired by awk and C.
bpftrace allows you to write simple scripts to count events, measure time, and inspect kernel state. For profiling your eBPF code, you can:
- Count eBPF Program Invocations: Determine how often a specific eBPF program is being triggered. This helps understand the load on a particular probe.
- Measure eBPF Program Execution Time: Instrument the entry and exit points of your eBPF program to measure its duration. This is crucial for identifying slow-running programs.
- Profile eBPF Helper Function Calls: Understand which kernel helper functions your eBPF code relies on most heavily and their associated costs.
For example, to measure the execution time of an eBPF program attached to a kprobe named my_ebpf_prog, you might use a bpftrace script like this:
bpftrace -e 'kprobe:my_ebpf_prog { @start[tid] = nsecs; } kretprobe:my_ebpf_prog /@start[tid]/ { $duration = nsecs - @start[tid]; printf("eBPF prog took %d ns\n", $duration); delete(@start[tid]); }'This script records the nanosecond timestamp at the start of the probe, calculates the difference at the return, and prints the duration. Aggregating these durations can give you an average or percentile execution time.
2. Leveraging Kernel Performance Events (perf)
The standard Linux performance analysis tool, perf, can also be used to profile eBPF code, albeit indirectly. While perf typically profiles user-space applications or kernel functions, it can sample the instruction pointer (IP) of the CPU. If your eBPF program is causing significant CPU usage, perf can show that this usage is occurring within the kernel context, and by correlating with eBPF maps or symbols (if available), you can infer which eBPF code is responsible.
perf can sample the kernel stack. By running perf record -g -k 1 -a -- sleep 10, you can capture samples of kernel activity. Analyzing the output with perf report might reveal that a substantial portion of kernel CPU time is spent in eBPF-related functions or within the eBPF verifier. This is more of a high-level indicator than a precise profiler for a single eBPF program, but it's useful for understanding the overall impact of eBPF on system performance.
3. eBPF Program Size and Complexity Limits
The eBPF verifier is a critical component that ensures eBPF programs are safe to run in the kernel. It checks for infinite loops, invalid memory accesses, and other potential issues. While not a profiling tool in the traditional sense, understanding the verifier's constraints can indirectly help optimize eBPF code for performance. A program that is rejected by the verifier needs to be rewritten, and often, a more complex or less efficient program can be simplified to pass verification, leading to better performance.
The verifier performs a state-space exploration of the eBPF program. Each instruction is analyzed. If a program is too complex or has too many branches, it can take a long time for the verifier to complete its checks. While the verifier's runtime is not directly part of the eBPF program's execution time, an overly complex program might hint at potential performance issues once it does run.
Advanced Profiling Tools and Libraries
BCC (BPF Compiler Collection)
BCC provides a set of powerful tools and a Python/Lua interface for writing eBPF programs. Many BCC tools are designed for performance analysis and can be adapted to profile your custom eBPF code. For instance, tools like profile.py or specific network/syscall tracing scripts within BCC can be modified to hook into your eBPF programs or the functions they call.
BCC simplifies the process of compiling and loading eBPF programs. It often uses C for the eBPF code and Python for the user-space controller. You can write custom BCC scripts to:
- Collect latency histograms for specific eBPF operations.
- Trace function calls within your eBPF program using tracepoints or kprobes.
- Monitor eBPF map access patterns and performance.
libbpf and BPF CO-RE
For more complex deployments and easier portability, libraries like libbpf are becoming standard. Combined with BPF CO-RE (Compile Once – Run Everywhere), you can write eBPF programs in C that are compiled once and run on different kernel versions. Profiling with libbpf typically involves instrumenting your C code with timing mechanisms or using libbpf's event reporting capabilities to send performance data to user space.
When using libbpf, you can:
- Add explicit timing calls (e.g., using
bpf_ktime_get_ns()) around critical sections of your eBPF code. - Use
bpf_printk()for simple debugging output, though this can be noisy. - Implement custom eBPF maps to store profiling data (like histograms or counters) that your user-space application can then read and analyze.
The user-space loader built with libbpf can then periodically poll these maps or receive data via perf buffers or ring buffers, providing the profiling results.
What Nobody Has Addressed Yet: Long-Term eBPF Performance Degradation
While current profiling tools help identify immediate performance issues, a critical unanswered question is how to monitor and profile for long-term performance degradation of eBPF code. As kernel versions update, or as system workloads change, an eBPF program that was once efficient might become a bottleneck. Detecting subtle performance regressions over time, especially in dynamic environments like Kubernetes clusters, requires continuous, low-overhead profiling and anomaly detection mechanisms tailored for eBPF. Developing standards or best practices for this continuous monitoring is an area ripe for innovation.
Best Practices for eBPF Profiling
When profiling your eBPF code, keep these best practices in mind:
- Minimize Profiling Overhead: The profiling mechanism itself should not significantly impact the performance of the system or the eBPF program being profiled. Use eBPF-based tools for profiling whenever possible, as they generally have lower overhead than older tracing methods.
- Target Specific Bottlenecks: Don't try to profile everything at once. Focus on the suspected areas of slowness or high resource consumption.
- Understand Your Probes: Be precise about where you attach your eBPF programs. Attaching to high-frequency events (like every network packet or syscall) can generate a massive amount of data, overwhelming your profiling efforts.
- Use Appropriate Data Structures: For collecting statistics, use eBPF maps like histograms or arrays to aggregate data efficiently within the kernel before sending it to user space.
- Iterate and Refine: Profiling is an iterative process. Analyze the results, make changes to your eBPF code, and profile again to confirm improvements.
By systematically applying these profiling techniques and tools, developers can ensure their eBPF programs are efficient, reliable, and do not negatively impact system performance.