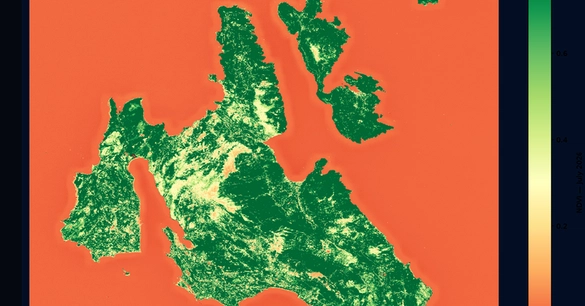
The Goal: A Custom Vegetation Map
The objective was clear: generate a baseline vegetation map for an entire island. This wasn't about consulting government reports or purchasing datasets. The aim was to leverage the freely available data from the European Space Agency's Sentinel-2 satellite, which provides cloud-free acquisitions updated every five days. The end product desired was a Normalized Difference Vegetation Index (NDVI) layer, queryable for specific insights.
The Technical Stack
To achieve this, a specific set of tools was employed. Python served as the primary programming language, augmented by libraries like rasterio and xarray for efficient handling of geospatial raster data. Geographic Information System (GIS) operations, specifically reprojection, were managed by GDAL. Sentinel-2 data is typically distributed in the Universal Transverse Mercator (UTM) 34N projection, but for web mapping purposes, the standard World Geodetic System (WGS 84) projection (EPSG:4326) was required. The processing was performed on a standard laptop, highlighting the accessibility of the task for individuals without high-performance computing clusters, albeit with a significant time investment and moderate sleep.
Encountering the Sentinel-2 Data Format
The primary hurdle emerged from the Sentinel-2 data's distribution format. While the data itself is free, its structure presents a significant challenge, often described as a complex puzzle. The Sentinel-2 archive uses the .SAFE (Standard Archive Format for Europe) format, which is essentially a directory structure containing multiple files rather than a single, easily accessible data file. This structure includes various subdirectories for metadata, quality information, and the actual image bands. Navigating and extracting the necessary information from this complex archive required a methodical approach.
Each `.SAFE` folder contains numerous files, including XML metadata files that describe the scene, sensor characteristics, and processing levels, alongside the actual image data organized by spectral bands. For NDVI calculation, specific bands (typically the red and near-infrared bands) are required. The challenge lies in identifying the correct files within the archive, parsing the associated metadata to understand coordinate systems and resolutions, and then extracting the relevant band data for processing. This multi-step extraction and parsing process is a significant part of the work involved, often underestimated by those new to Earth observation data.
Processing Pipeline and NDVI Calculation
The processing pipeline involved several key stages. First, the relevant `.SAFE` archive for the target area (Kefalonia island) and the desired date range was downloaded. Given the requirement for cloud-free imagery, this often involves checking multiple acquisition dates and selecting the best available scene. Once downloaded, the data needed to be unpacked or accessed directly from the `.SAFE` structure.
The next critical step was reprojection. As mentioned, Sentinel-2 data is often in UTM, and for integration into a web map or for consistent analysis across different regions, conversion to WGS 84 (EPSG:4326) is necessary. GDAL's `gdalwarp` utility is a standard tool for this task, ensuring that the spatial referencing is accurate and compatible with other geospatial datasets. This reprojection step is computationally intensive, especially for large scenes.
With the data reprojected and aligned, the NDVI calculation could proceed. NDVI is a simple but powerful index that measures vegetation health and density. It is calculated using the formula: NDVI = (NIR - Red) / (NIR + Red), where NIR is the reflectance in the near-infrared spectrum and Red is the reflectance in the red visible spectrum. Both bands needed to be extracted from the Sentinel-2 data, aligned spatially, and then processed using the formula. Libraries like rasterio and xarray facilitate these array-based calculations efficiently.
The result of this calculation is a raster layer where pixel values range from -1 to +1. Values close to +1 indicate dense, healthy vegetation, while values close to 0 or negative indicate sparse vegetation, bare soil, or water. This NDVI layer then serves as the baseline vegetation map of the island.
Challenges and Lessons Learned
The 48-hour timeframe, while successful, was described as involving "moderate sleep," underscoring the effort required. The primary difficulties stemmed from the complexity of the `.SAFE` format and the need for careful data handling and reprojection. For developers new to Earth observation data, the initial learning curve associated with understanding data structures, metadata, projections, and the specific spectral bands required for different indices can be steep. The process is less about a single complex algorithm and more about orchestrating multiple data wrangling and processing steps.
The success of processing the first Sentinel-2 pass demonstrates the feasibility of creating custom geospatial products from freely available satellite data. However, it also highlights the need for robust tooling and a clear understanding of the data's characteristics. Future iterations might involve automating the download process, optimizing the reprojection step, or exploring cloud-based processing solutions for larger areas or more frequent updates. The journey from raw satellite data to a usable NDVI map is a testament to the power of open data and accessible processing tools, even if it requires a significant personal investment of time and effort.
The immediate output is a visual representation of vegetation health across Kefalonia. This can be used for various applications, including agricultural monitoring, environmental change detection, or urban planning. The ability to query this map allows for specific land parcels or regions to be analyzed, providing a data-driven foundation for decision-making. The process, while intensive for a single pass, sets a repeatable workflow for ongoing monitoring and analysis.
Future Directions
The successful completion of this first pass opens up several avenues for future development. Automating the entire workflow, from checking for new satellite acquisitions to generating the final NDVI layer, would be a logical next step. This could involve scripting the download process, perhaps using Copernicus Open Access Hub APIs or similar services, and integrating the entire processing chain into a single, runnable script. Furthermore, exploring more efficient reprojection methods or leveraging cloud computing platforms could significantly reduce processing time for larger areas or higher-frequency updates. Investigating other spectral indices derived from Sentinel-2 data, such as the Normalized Burn Ratio (NBR) or the Enhanced Vegetation Index (EVI), could provide deeper insights into different aspects of the land surface.