The Evolving Complexity of Computer Vision Pipelines
Computer vision pipelines often begin with a deceptively simple structure: an image is loaded, processed by a model, and the resulting detections are visualized. This initial flow might look like:
Image → Model → Detections → Annotation → OutputHowever, real-world computer vision applications quickly outgrow this basic setup. Developers invariably add layers of complexity to handle diverse scenarios and improve performance. These additions can include preprocessing steps like resizing and tiling, multiple inference stages, merging results from different models, filtering false positives, object tracking, coordinate transformations, and sophisticated annotation logic. The pipeline transforms into a sprawling, interconnected system.
A more representative, albeit still simplified, complex pipeline might resemble this:
                      ┌→ Model
                      │
Image → Resize → Tile ─→ Model → Merge → Filter → Track → Annotate → ...
                      │
                      └→ ...
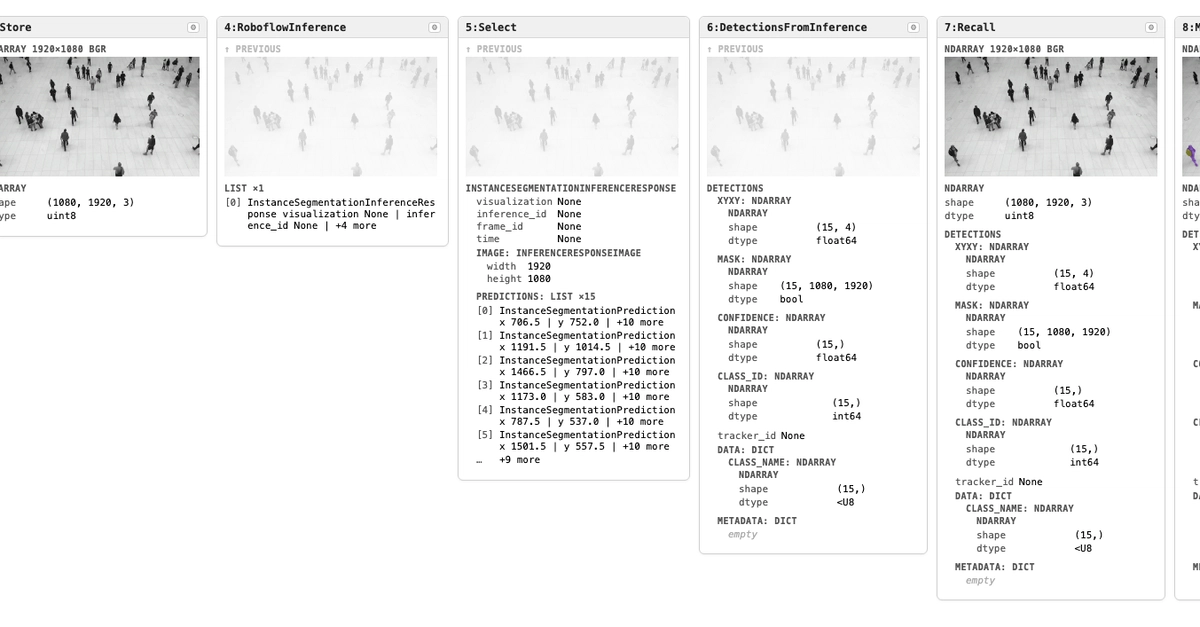
At this stage, while each individual component might be well-understood in isolation, the entire pipeline becomes a black box. Debugging issues in such a system is akin to finding a needle in a haystack. When a pipeline fails to produce expected results—whether it's missing detections, incorrect classifications, or performance degradation—pinpointing the root cause becomes a significant challenge. Is the problem in the initial image loading, a specific preprocessing step, an issue with the model's inference, a bug in the tracking algorithm, or an error in the final annotation? Without a clear way to inspect the intermediate states, developers are left guessing.
The core problem is a lack of inspectability. Developers need to understand what is happening at each stage of the pipeline, not just at the beginning and the end. This means being able to visualize or query the data as it passes through each transformation, filter, or model inference. This visibility is crucial for efficient debugging, performance optimization, and iterative development. Without it, development cycles lengthen, and the confidence in the system's reliability diminishes.
Why Inspectability Matters
The need for inspectability is not merely an academic concern; it directly impacts the practicality and scalability of computer vision systems. Consider the iterative nature of developing these systems. A developer might train a model, deploy it into a pipeline, observe its performance, and then decide to retrain the model, adjust preprocessing, or add a new filtering step. If the pipeline is opaque, it's difficult to determine which of these changes had the intended effect or if they introduced new problems. Was the model performance poor due to insufficient training data, or was it a result of an upstream resizing operation that distorted features?
Inspectability provides the necessary feedback loop. It allows developers to:
- Debug efficiently: Quickly identify which step is introducing errors or unexpected behavior. This is like having diagnostic tools for every component of a complex machine.
- Optimize performance: Understand where bottlenecks exist. Is a particular model inference taking too long? Is data being unnecessarily duplicated or reformatted between steps?
- Validate intermediate results: Ensure that data transformations are behaving as expected. For example, verifying that a resizing operation maintains aspect ratio or that a segmentation mask is correctly generated.
- Improve model understanding: Sometimes, the pipeline itself can reveal insights into model behavior. Visualizing feature maps or intermediate activation can aid in understanding why a model makes certain predictions.
Without inspectability, debugging a complex computer vision pipeline can feel like trying to diagnose a patient with a black box covering their entire body. You can see if they are alive (output is generated) and maybe guess their general condition (overall performance), but you can't pinpoint a broken bone or an internal bleed. Inspectability provides the X-ray and MRI capabilities for your CV pipeline.
Approaches to Enhancing Inspectability
Several strategies can be employed to make computer vision pipelines more inspectable. These often involve instrumenting the pipeline to log or visualize intermediate data and states.
Logging and Visualization Tools
At a basic level, developers can augment their pipeline code to log key information at each stage. This might include image data (or downsampled versions), model outputs (bounding boxes, class probabilities, segmentation masks), and feature vectors. However, raw logs can be overwhelming. Visualization tools are essential for making this data digestible.
Tools like TensorBoard, Weights & Biases, or MLflow offer functionalities to log and visualize metrics, images, and model artifacts. For computer vision, specialized capabilities are needed:
- Image logging: Saving images at various stages, potentially with annotations overlaid.
- Annotation visualization: Displaying bounding boxes, masks, keypoints, and other annotations clearly.
- Model output comparison: Showing ground truth annotations alongside model predictions for easy comparison.
- Data profiling: Analyzing distributions of object sizes, aspect ratios, or class frequencies at different pipeline stages.
These tools allow developers to step through the pipeline, inspect the output of each component, and compare it against expectations or ground truth. This turns the black box into a series of observable checkpoints.
Pipeline Orchestration Frameworks
More advanced solutions involve using specialized pipeline orchestration frameworks designed with inspectability in mind. These frameworks often provide:
- Visual pipeline editors: Allowing users to build and visualize their pipelines graphically, offering an immediate overview of the workflow.
- Integrated debugging interfaces: Providing a user interface to step through pipeline execution, inspect data at each node, and modify parameters on the fly.
- Data lineage tracking: Recording how data is transformed and where it originates, which is invaluable for debugging complex dependencies.
- Reproducibility features: Ensuring that experiments and pipeline runs can be precisely reproduced, which is critical for scientific rigor and debugging.
Examples of such frameworks, or libraries that facilitate this, include libraries like Apache Beam for data processing pipelines, or more specialized MLOps platforms that offer visual DAG (Directed Acyclic Graph) representations of workflows. The key is that these tools treat the pipeline not just as a sequence of operations, but as a structured entity that can be interrogated.
Domain-Specific Libraries and Abstractions
Some libraries are emerging that focus on making specific parts of the CV pipeline more inspectable. For instance, libraries might offer abstractions for common tasks like object detection or segmentation that include built-in visualization hooks. When using these abstractions, developers can often enable detailed logging or visual output with minimal code changes. This is akin to buying a pre-assembled engine with diagnostic ports rather than building one from scratch and adding ports yourself.
The challenge remains in integrating these disparate tools and approaches into a cohesive workflow. A developer might use one tool for model inference visualization and another for tracking data lineage. The ideal solution would offer a unified interface for inspecting all aspects of the pipeline.
The Future of Inspectable CV
As computer vision models become more powerful and pipelines grow in complexity, the demand for inspectability will only increase. The trend is moving towards MLOps practices that emphasize transparency and reproducibility. Tools that offer deep visibility into the entire lifecycle of a computer vision model—from data ingestion and preprocessing through inference and post-processing—will become indispensable. This will enable faster innovation, more robust deployments, and greater trust in the autonomous systems powered by computer vision.