The Limits of Traditional Debugging for AI Agents
For years, AI agents have been trained to debug code using traditional methods: setting breakpoints, stepping over lines, and continuing execution. This approach, facilitated by protocols like the Debug Adapter Protocol (DAP), allows agents to interact with the execution flow of programs. However, this is only half the battle. Real-world debugging often involves more than just code inspection. It requires interacting with user interfaces, observing visual cues, and understanding the state of an application through its graphical elements. The excerpt from dev.to highlights this critical gap: a backtrace won't tell you why a 'Save' button is disabled. Can AI agents replicate this crucial, often manual, part of the debugging process?
Debugging the Web: An Achievable Frontier
The web presents a relatively straightforward environment for AI agents to tackle this 'clicking' aspect of debugging. Browsers are inherently designed for automation. Tools like Playwright are built to interact with web pages programmatically. Every element on a webpage has a stable, queryable handle. The Document Object Model (DOM) essentially acts as an accessibility tree, providing structured information about roles, labels, and element hierarchy. This makes it feasible for agents to 'see' and interact with web interfaces. They can identify elements, read their properties, and even simulate user interactions like clicks. For web-based applications, this visual debugging half is becoming increasingly within reach for advanced AI agents.
Beyond the Browser: The Challenge of Native Applications
The complexity escalates significantly when moving beyond web applications to native desktop or mobile applications. Unlike the web's standardized DOM, native UIs are built using platform-specific frameworks (e.g., WinForms, WPF, Cocoa, Android SDK). Each framework has its own way of representing UI elements, their states, and their interdependencies. There isn't a universal accessibility tree or a single queryable handle for every element across all native platforms. This fragmentation makes it substantially harder for AI agents to reliably inspect and interact with these interfaces. An agent that can easily navigate a website might struggle to identify a disabled button or a specific dialog box in a desktop application without specialized tooling or extensive platform-specific training.
The Missing Piece: State Observation and Interaction
The core challenge lies in enabling AI agents to understand and react to the *state* of an application as perceived by a human user. This involves more than just executing code. It means:
- Visual Recognition: Identifying buttons, text fields, checkboxes, and other UI elements based on their appearance and context.
- State Interpretation: Understanding what the current state of these elements signifies (e.g., a greyed-out button means it's inactive, a red error message indicates a problem).
- Interactive Capabilities: Simulating user actions like clicking, typing, selecting options, and navigating menus.
- Contextual Awareness: Correlating UI states with the underlying code execution or application logic to diagnose issues.
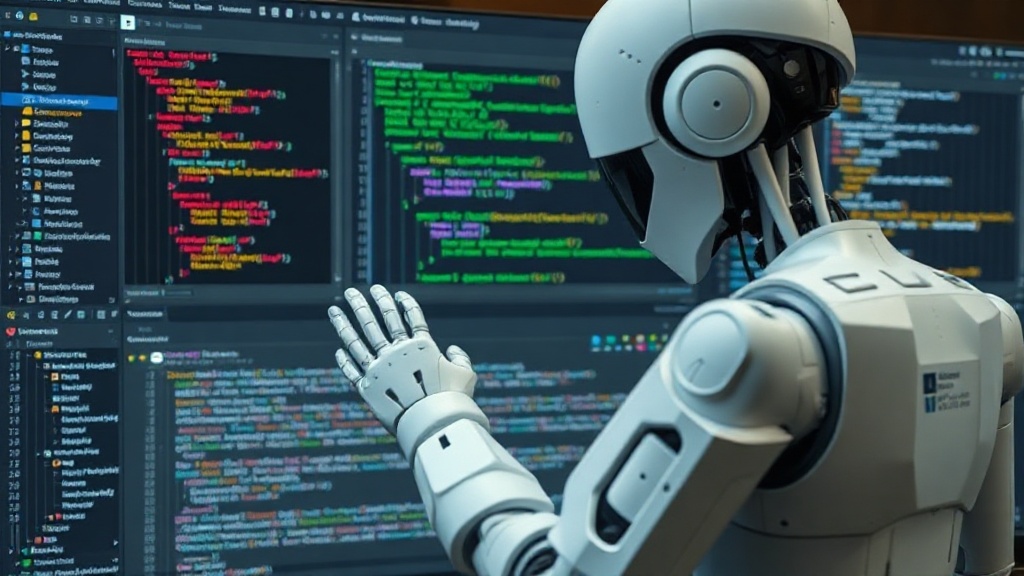
Currently, most debugging agents operate primarily within the code editor, interacting with abstract representations of program flow. They lack the 'eyes' and 'hands' to engage with the rich, often dynamic, visual layer of applications.
Bridging the Gap: Future Directions for Debugging Agents
To truly empower AI agents for comprehensive debugging, several advancements are necessary:
- Cross-Platform UI Automation Frameworks: Development of more robust and standardized tools that can abstract away the platform-specific complexities of UI inspection and interaction. Think of a 'universal Playwright' for desktop and mobile.
- Visual Understanding Models: Training AI models to interpret screenshots or UI element hierarchies to identify interactive components and their states, similar to how humans perceive them. This could involve integrating computer vision techniques with traditional UI element analysis.
- Event-Driven Interaction: Enabling agents to respond to UI events (e.g., a dialog appearing, a button becoming enabled) and to trigger actions based on these events, rather than solely relying on explicit code breakpoints.
- Integration with Human Debugging Workflows: Designing agents that can seamlessly collaborate with human developers, taking over the repetitive 'clicking' tasks or providing insights based on observed UI states that might be missed in a pure code-based debugging session.
The journey from breakpoint-driven debugging to a more holistic, visually-aware approach is complex. It requires a fundamental shift in how we equip AI agents with the ability to perceive and interact with the user-facing aspects of software. Until agents can effectively 'click' and interpret what they see, their debugging capabilities will remain incomplete, leaving a significant portion of real-world problem-solving to human intuition and manual effort.
What happens to the vast ecosystem of legacy applications and specialized enterprise software that lack modern, easily automatable UIs? Will AI debugging tools ever be able to effectively assist in diagnosing issues within these complex, often opaque, environments, or will they remain confined to the more structured domain of web applications?