
From Text to Temporal Knowledge Graph
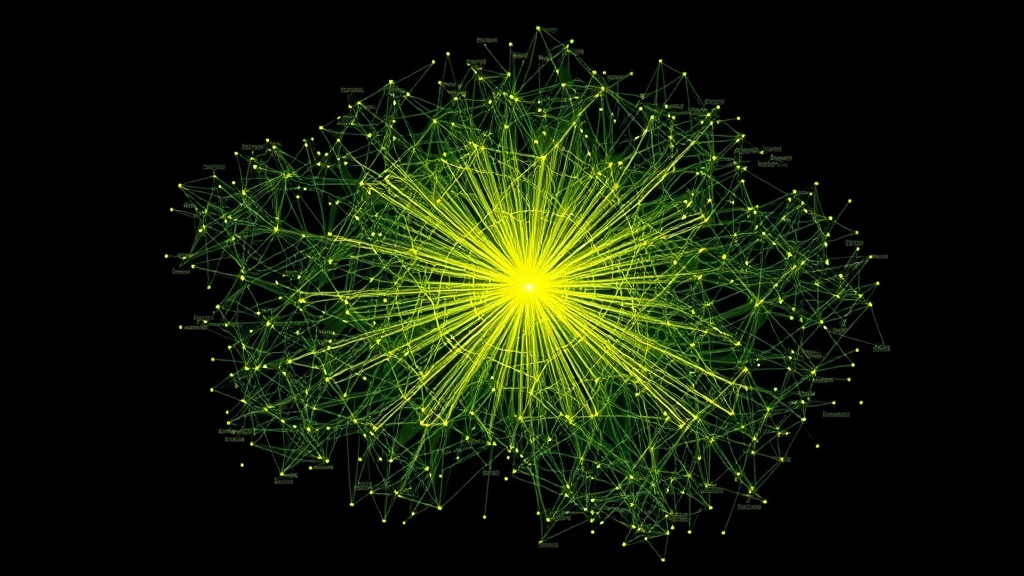
A recent Show HN on Hacker News introduced a fascinating project: the visualization of 180,000 words from the "Oz" series as a temporal knowledge graph. This endeavor, presented by Synaptale, offers a unique perspective on how narrative structure and thematic evolution can be represented and understood through graph-based models. The core idea is to transform a static block of text into a dynamic, interconnected web of entities, events, and their relationships over time.
Knowledge graphs are powerful tools for organizing and querying information. They represent data as nodes (entities) and edges (relationships). A temporal knowledge graph adds a crucial dimension: time. This allows for the tracking of how entities interact, change, and evolve throughout a narrative or historical period. In this case, the "Oz" series, a substantial body of text, serves as the source material. The project aims to make the implicit connections and chronological flow within the story explicit and navigable.
The sheer volume of 180,000 words is significant. Representing this amount of textual data in a traditional linear format can obscure the intricate web of character interactions, plot developments, and thematic shifts that occur. By converting this text into a temporal knowledge graph, the project provides a novel way to explore these nuances. It's less like reading a book and more like navigating a living map of the story's universe.
The 'Oz' Series as a Case Study
The choice of the "Oz" series is not arbitrary. L. Frank Baum's original books, and the subsequent works by other authors, form a rich tapestry of characters, locations, magical elements, and evolving plotlines. This complexity makes it an ideal candidate for a knowledge graph approach. The project likely identifies key entities such as characters (Dorothy, Scarecrow, Tin Woodman, Cowardly Lion, the Wizard, etc.), places (Kansas, Oz, Emerald City), and significant objects or concepts (ruby slippers, magic, different kingdoms). The temporal aspect would then map out their introductions, interactions, departures, and the unfolding of events across the books.
Consider the journey of Dorothy. In a temporal knowledge graph, her arrival in Oz, her interactions with the Scarecrow, Tin Woodman, and Cowardly Lion, their collective quest to the Emerald City, their encounters with various antagonists and allies, and her eventual return to Kansas would all be plotted as nodes and edges with time stamps or sequence markers. This allows for an analysis of character development, the causality of plot events, and the geographical spread of the narrative.
Technical Underpinnings and Potential Applications
While the Show HN post itself is concise, the underlying technology to achieve this involves several sophisticated steps. Typically, this would include Natural Language Processing (NLP) techniques for entity recognition (identifying people, places, organizations) and relation extraction (determining how entities are connected). Temporal information extraction would be crucial to assign a time or sequence to these relationships. This extracted data is then structured into a graph database, optimized for querying and traversal.
The Synaptale project, by presenting this visualization, opens up a world of potential applications beyond literary analysis. Imagine applying this to historical documents, scientific literature, legal case files, or even complex corporate structures. A temporal knowledge graph derived from historical texts could reveal subtle shifts in political alliances or economic trends over decades. Scientific papers could be mapped to show the evolution of research ideas and the connections between different fields of study. For a legal team, mapping out the timeline of events and involved parties in a complex case could be invaluable.
The surprising detail here is not the volume of text but the fidelity with which relationships can be mapped over time. Many text analysis tools offer keyword frequency or topic modeling. A temporal knowledge graph, however, goes deeper, showing not just *what* is discussed but *who* is discussing it, *when*, and *in relation to what else*. It transforms raw text into a queryable, dynamic model of information.
Navigating the Narrative Landscape
The presentation on Hacker News, often a hub for technically-minded individuals, likely sparked discussion about the specific tools and algorithms used. It also raises questions about the scalability of such an approach. Can 180,000 words be considered a large dataset for this type of analysis, or is it just the beginning? What happens when you scale this to entire libraries or historical archives?
The "Oz" series temporal knowledge graph serves as a compelling proof of concept. It demonstrates the power of graph databases and temporal data modeling to unlock new insights from unstructured text. For developers and researchers interested in information retrieval, computational linguistics, or even digital humanities, this project offers a tangible example of how complex textual data can be rendered into an interactive and informative structure. It’s a digital cartography of narrative, charting the flow of events and relationships across the vast landscape of a story.
If you're a developer working on text analysis or information extraction tools, this project offers a concrete example of how to move beyond simple keyword analysis to a more nuanced understanding of textual content. The temporal dimension, in particular, is key to understanding causality and evolution within any data set that has a chronological component.